Data
Each data has multiple questions and question groups.
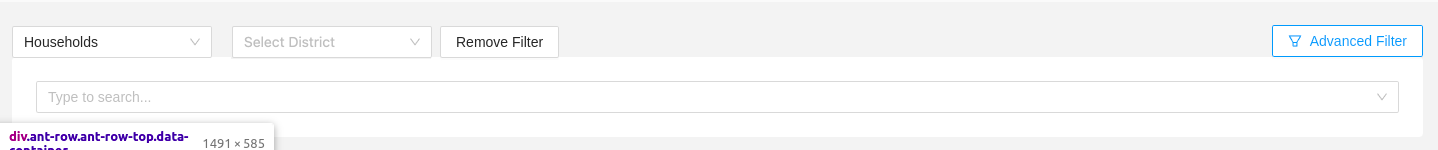
Search
Selecting
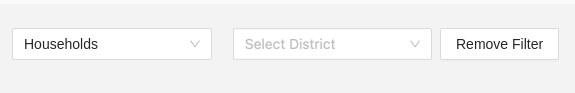
Filtering a data point by selecting name, district, sub-district and village
You reset your search by clicking the REMOVE FILTER button.
Advanced search
If you wish to search in more advanced way, an Advanced filter button is clickable that shows an input select.
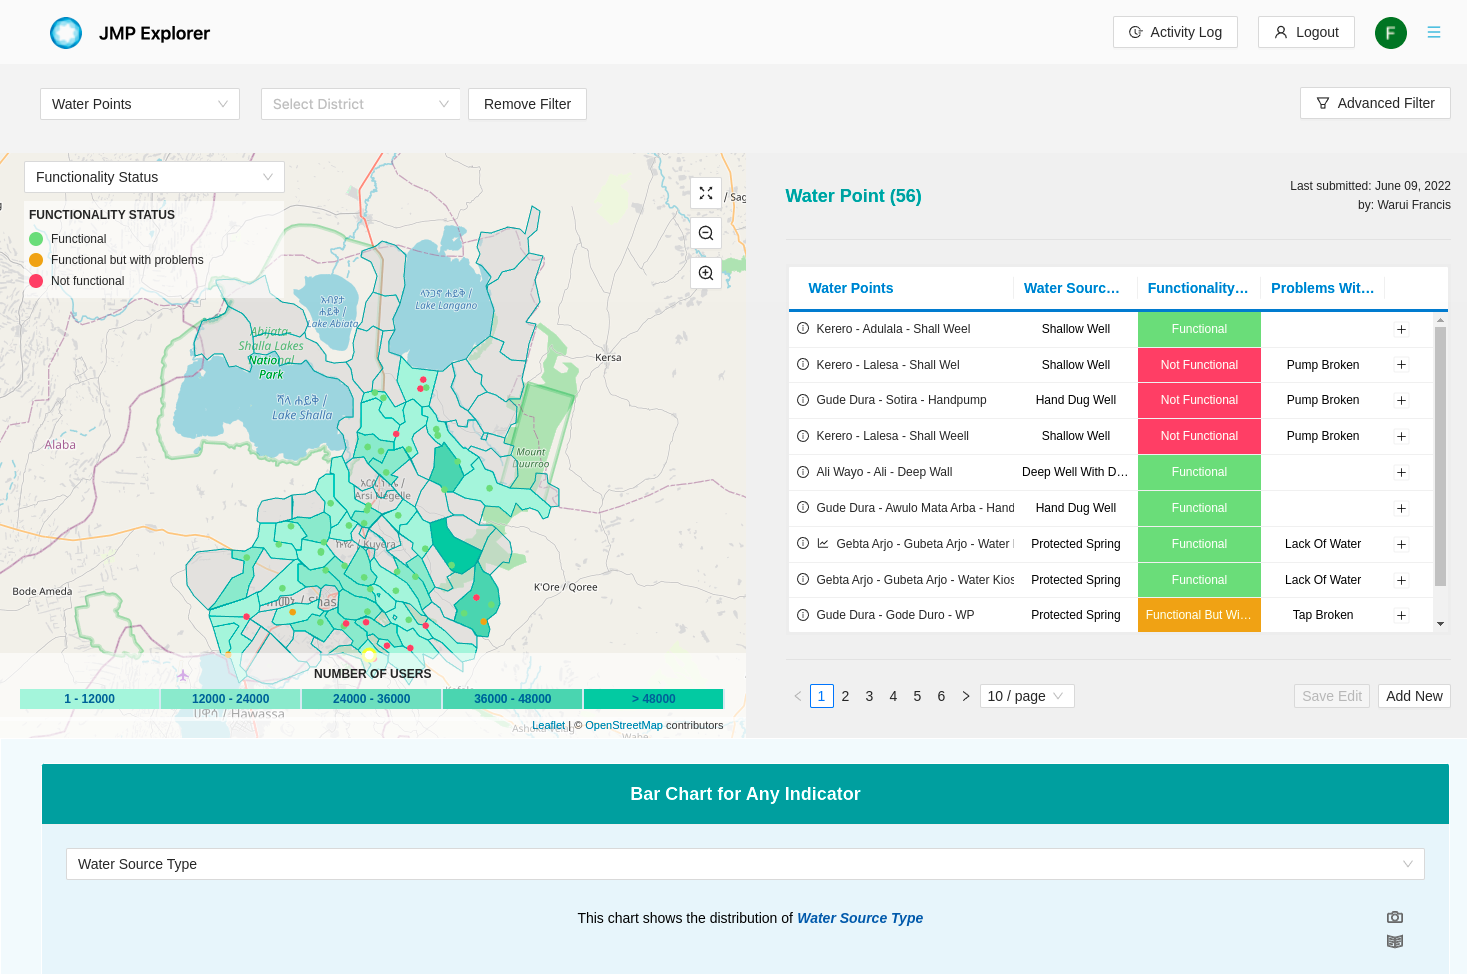
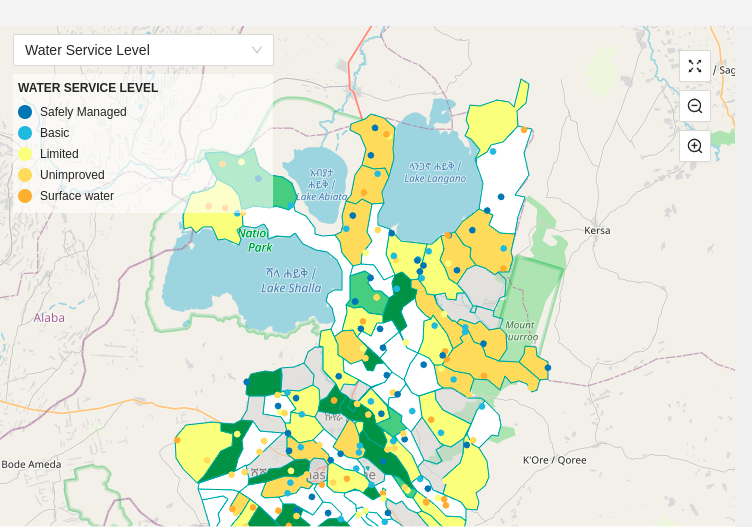
Maps
A map is on the page which shows all places, district, sub-district and village from where the data is collected.
This map can be zoomed out or in
Maps Legend
A legend that displays the level of data services is shown on the page under the map.
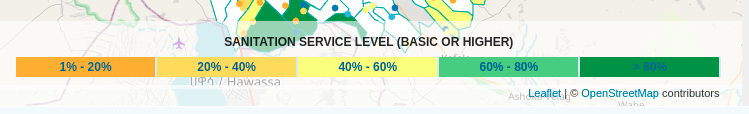
Chart data
JMP
A chart is also on the page once the JMP tab is active
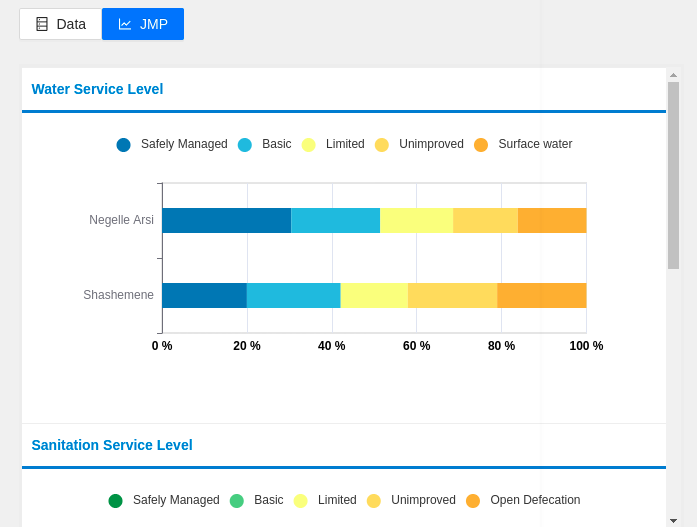
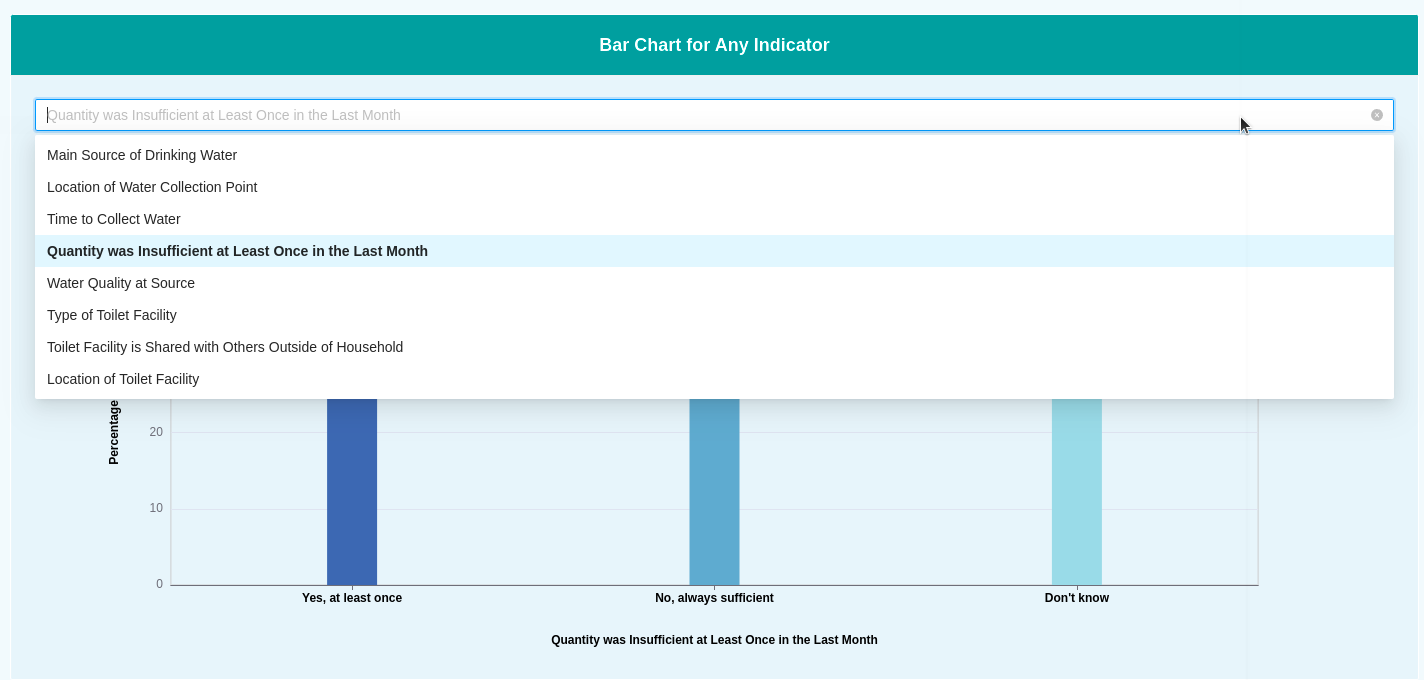
Bar
A disruption of a question is shown on a Bar char. To see this, you have to select a question.
This bar chart can also be saved as an image by clickin on the SAVE IMAGE icon.
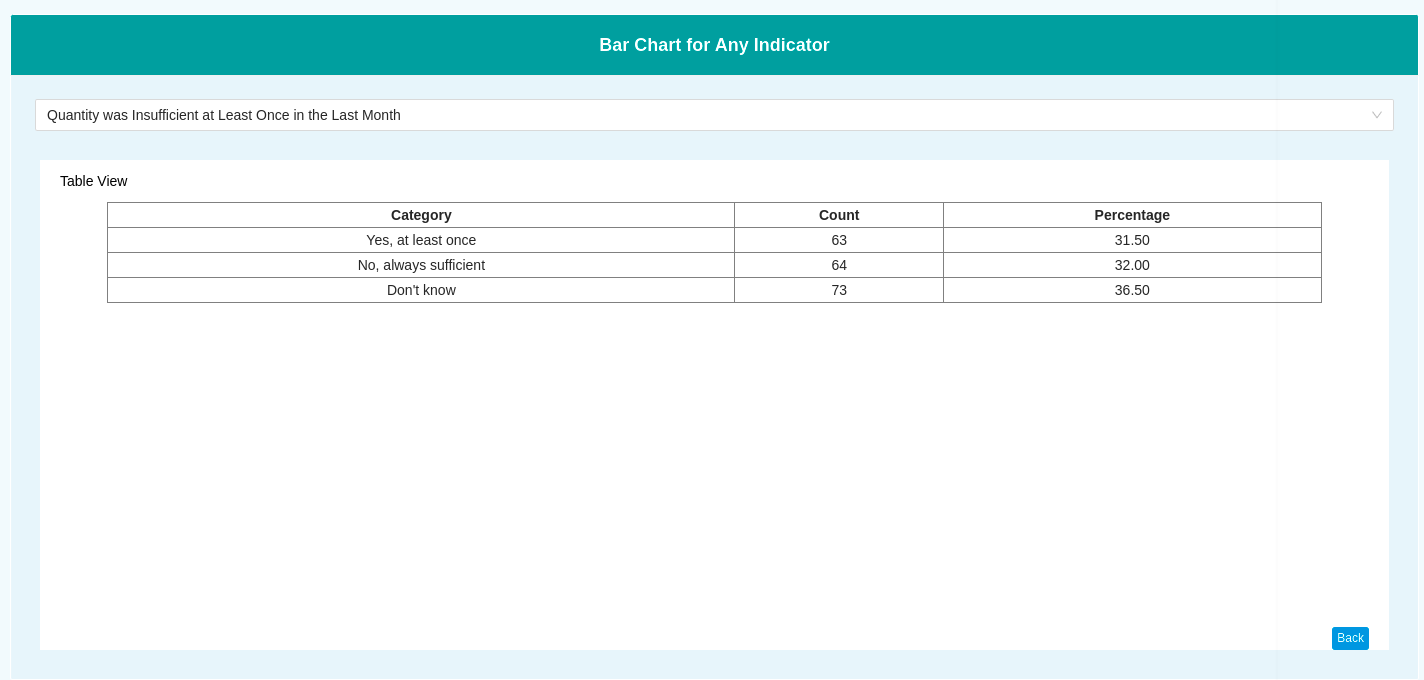
If you would love to see the question value on a table, there is table icon that can be clicked to do so.